Setting up Xdebug's profiler with Laravel Herd & PHPStorm
Heads up: This post is more than 1 year old, so some of it may be out-of-date.
Laravel Herd now has first-party support for profiling, without needing to change any Xdebug settings. See their documentation: https://herd.laravel.com/docs/1/advanced-usage/profiler
I recently made the switch to Laravel Herd, after using Valet for years. Even though Herd is still using Valet under the hood, I've found it to be considerably faster than plain Valet.
One of the things I've been wanting to do for a while is to setup Xdebug in order to perform performance profiling, without needing to subscribe to a service like Blackfire.
Setting up Xdebug with Laravel Herd is pretty simple - you just have to follow a couple of steps on their docs to get it configured. Or, if you're using Herd Pro, it'll automatically enable Xdebug when it detects breakpoints in your code.
By default, Xdebug's debug mode will be configured. However, in order to do profiling, we need to switch to its profile mode instead, this involves a few additional steps:
-
Install Laravel Herd if you haven't already.
-
Enable Xdebug manually or purchase Herd Pro.
Herd Pro includes some pretty nifty features - like one-click setup for MySQL, Redis, Meilisearch, as well as local email debugging and dump logging (useful if you don't have a Ray license).
-
We need to append a short snippet to Herd's
php.iniconfiguration file in order to change the Xdebug mode. You can find Herd'sphp.inifiles at~/Library/Application Support/Herd/config/php/<version>/php.ini.
In addition to changing Xdebug's mode, it also sets the output directopry for the generated "cachegrind" files. I've got this set to the root of my project, but you're free to change this to where ever you like.
xdebug.mode = profile
xdebug.start_with_request = trigger
xdebug.output_dir = /Users/duncan/Code/Statamic/sandbox
-
In order for our changes in the
php.inifile to take affect, we'll need to reset Laravel Herd. You can do this from Herd's menubar menu: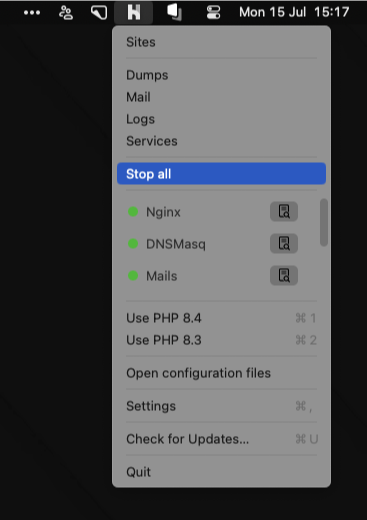
Click "Stop all", then "Start all". -
Next, in order for Xdebug to know you want to profile incoming requests, you'll need to install the Xdebug browser extension for whichever browser you're using (found in the Chrome & Firefox extension stores).
It'll add a little widget to your browser, allowing you to start and stop profiling sessions (or debugging sessions, if you switch back to
debugmode). -
Finally, you'll need to "Start Listening for PHP Debug Connections" in PHPStorm.
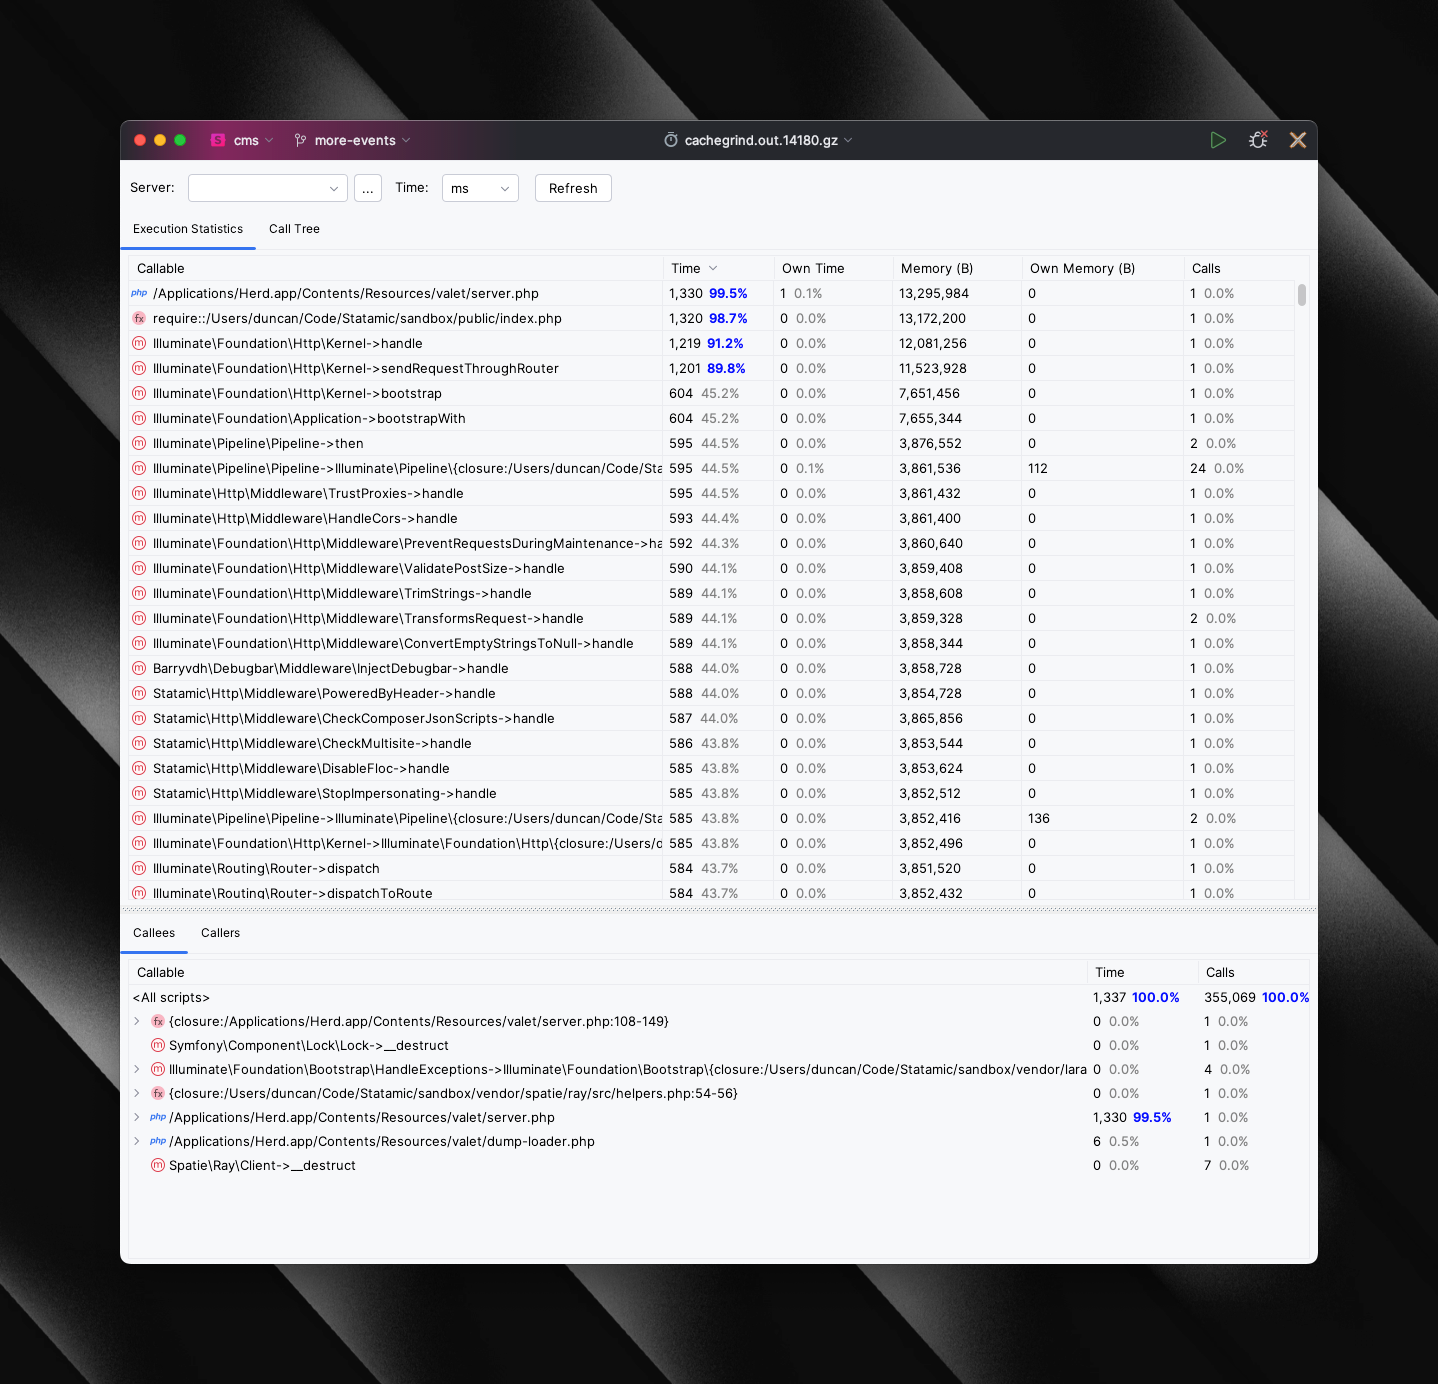
After PHPStorm is listening, visiting a page in your browser will generate a cachegrind.out... file in your chosen directory. The "Analyze Xdebug Profiler Snapshot" action will let you open this file and view the profiling snapshot.
If you ever need to switch back to debug mode, simply comment out the additions in Herd's php.ini file and restart Herd for the changes to take affect.
Note: I've only tested this on macOS, however, in theory, it should work the same way on > Windows but the php.ini file will be different.
Support my work
If you found this post helpful, consider sponsoring me on GitHub. It helps me keep writing and maintaining open source projects like Runway.
